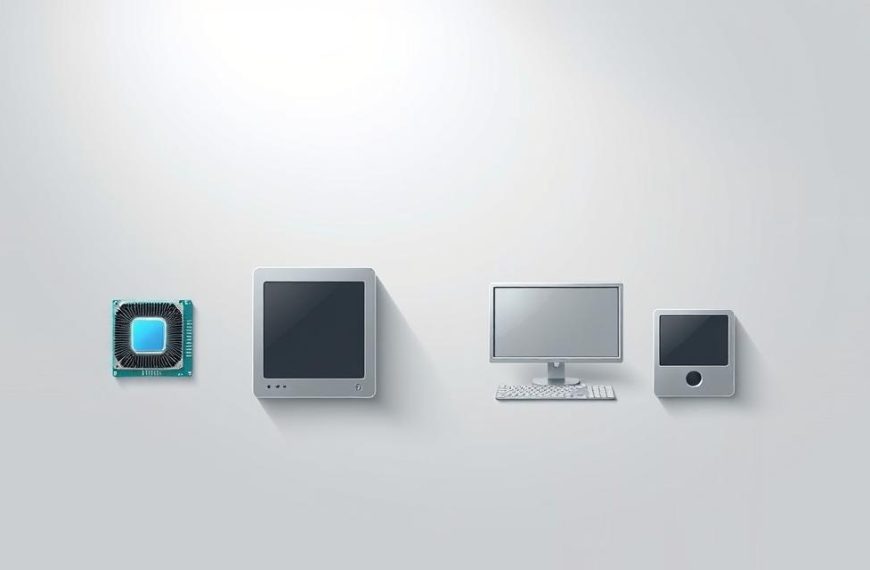
Understanding modern computing can seem like a maze of wires and technical terms. Hardware visualisation helps a lot. It turns complex systems into easy-to-understand layouts for students and IT experts.
Tools like Boardmix make things simpler. They offer features for teams to work together on component mapping. These diagrams help explain how data moves and find problems, making complex ideas clear.
Platforms like draw.io make it even easier. They let you customise diagrams with drag-and-drop tools. This helps everyone learn in their own way.
These visual aids are not just for learning. They help technicians fix problems fast and project managers plan upgrades smoothly. By showing how different parts work together, system diagrams help teams talk the same language.
As we look at each part, remember: every detail matters. These diagrams don’t just show technology. They explain it.
Understanding a Diagram of a Computer System
Computer system diagrams make complex tech easy to see. They help different people understand by showing details clearly. This balance is key.
Purpose of System Visualisation
Simplifying Complex Architectures
Technical schematics break down big systems into simple parts. They use things like Unified Modeling Language (UML) diagrams for software. Educational diagrams are simpler, like basic block diagrams.
Teaching tools focus on being easy to understand. They use colours and simple labels. But, professional guides follow ANSI/IEEE standards for exact symbols. This shows how different levels of detail are needed.
Standard Symbols and Conventions
Common Flowchart Elements
System diagrams use common shapes:
- Rectangles: Hardware components
- Arrows: Data flow direction
- Diamonds: Decision points
Hardware-Specific Icons
Technical diagrams show details clearly. For example, a server rack might show each blade server. But, educational diagrams use simpler shapes. This makes sure diagrams are useful for everyone.
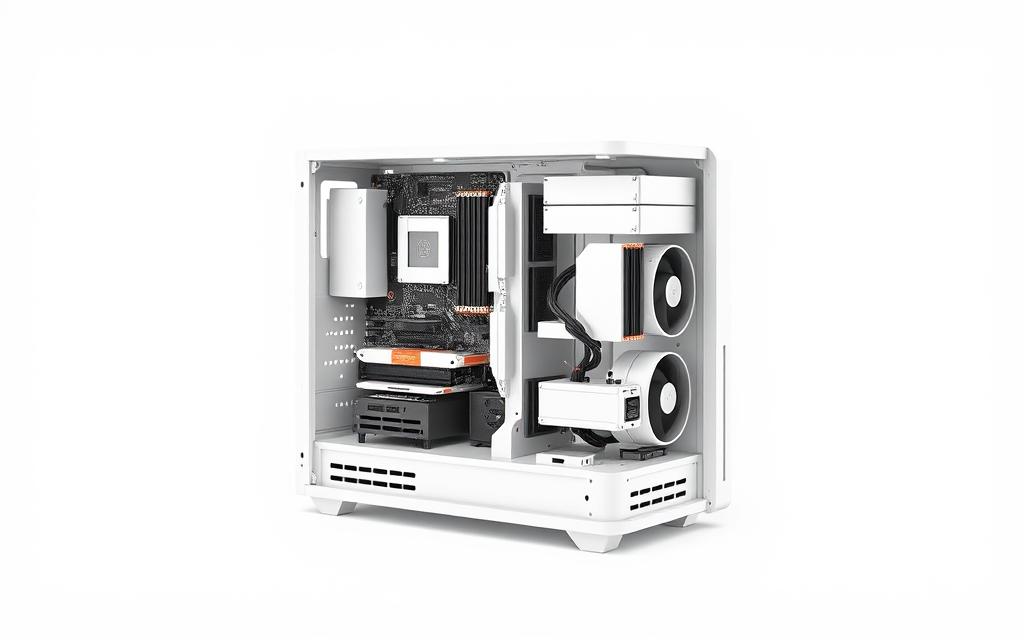
Core Hardware Components
Modern computers need three key parts to work well: processing power, structural connectivity, and stable energy. This section looks at these important parts with examples from manufacturers. It also includes technical diagrams for better understanding.

Central Processing Unit (CPU)
The CPU architecture comparison between Intel’s Core i9-13900K and AMD’s Ryzen 9 7950X shows different designs. Intel has a hybrid core with 24 threads. AMD uses a single 16-core Zen 4 design, made with 5nm technology.
Intel Core i9 vs AMD Ryzen architectures
Intel’s Performance-cores handle tough tasks at 5.8GHz. Efficiency-cores manage background tasks. AMD has uniform cores at 5.7GHz, using TSMC’s advanced node for better cooling.
Control unit and ALU functions
- Instruction decoding through micro-op cache
- Arithmetic Logic Unit handles 512-bit vector operations
- Branch prediction accuracy exceeding 95%
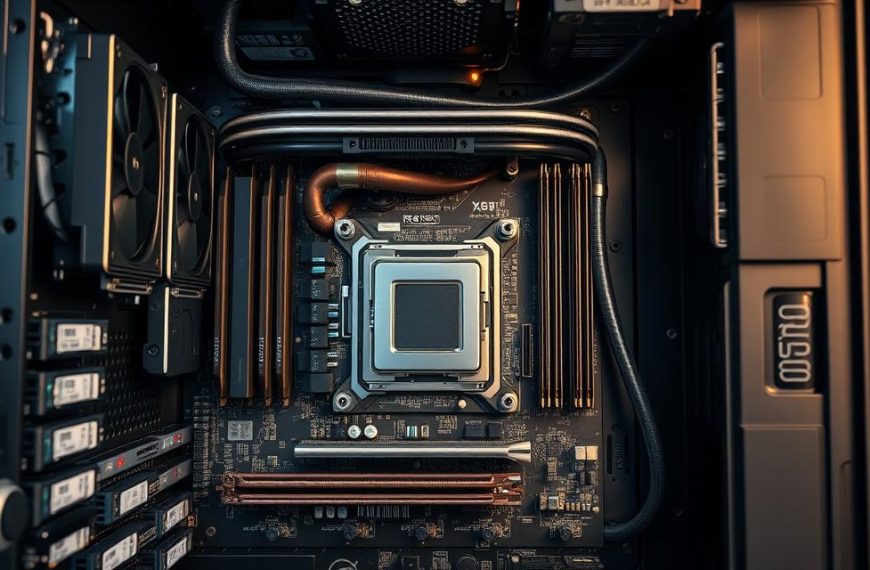
Motherboard Infrastructure
ASUS ROG Maximus Z790 shows off motherboard bus system skills with its PCIe 5.0 setup. The board has:
| Component | PCIe Lanes | Bandwidth |
|---|---|---|
| Primary GPU Slot | 16x Gen5 | 128GB/s |
| M.2 Storage | 4x Gen4 | 64GB/s |
| Chipset Link | 8x DMI 4.0 | 15.7GB/s |
ASUS ROG Maximus layouts
The board’s 20+1 phase VRM design ensures stable power to CPU parts. It uses aluminium alloy chokes to reduce electromagnetic interference.
Power Supply Unit (PSU)
Corsair’s RM850x shows off PSU voltage regulation with its digital signal monitoring. It keeps voltage stable across three main rails:
- 12V rail: 70.8A for GPU needs
- 5V rail: 25A for storage devices
- 3.3V rail: 22A for motherboard circuits
Voltage regulation paths
Japanese 105°C capacitors filter ripple currents. Synchronous rectification reaches 92% efficiency at 50% load. The DC-DC converter module stops cross-load interference between voltage lines.
Memory and Storage Systems
Modern computers use two main types of memory: volatile for quick tasks and non-volatile for keeping data safe. This part looks at how these systems work together. It uses diagrams to show their details.
Primary Memory Architecture
Crucial DDR5 RAM modules are key in today’s computers. They have fast transfer rates of 4800-6400 MT/s. Their design is better than DDR4, and they have on-die ECC for fewer errors.
They have:
- Dual 32-bit channels per module
- 1.1V operating voltage for efficiency
- Integrated power management circuits
Cache Memory Hierarchy
Modern processors have a three-tier caching system:
- L1: 64KB per core (3-cycle latency)
- L2: 512KB-1MB per core (12 cycles)
- L3: 16-32MB shared (35 cycles)
Secondary Storage Solutions
The Samsung 990 Pro SSD shows how NAND flash has evolved. It has a 176-layer 3D V-NAND structure. Its features include:
- Dual DRAM cache buffers
- PCIe 4.0 x4 interface
- Intelligent TurboWrite 2.0 technology
Western Digital HDD Platter Dynamics
Traditional hard drives use cobalt-alloy platters that spin fast. They spin at 5400-7200 RPM. Diagrams show their parts:
| Component | Function | Material |
|---|---|---|
| Platters | Data storage | Glass substrate |
| Actuator Arm | Read/write positioning | Aluminium alloy |
| Spindle Motor | Rotation control | Copper windings |
Input/Output Subsystem Mapping
Modern computers need clear peripheral interface diagrams to connect devices to the core hardware. This part looks at how devices talk to the computer through wires and wireless signals. We use real examples to show important ideas.
Peripheral Connectivity

Today’s USB-C port schematics show a detailed 24-pin setup. It supports up to 240W power delivery and 20Gbps data transfer. The design is reversible, using:
- Dual-lane differential signalling pairs
- Configuration channel for protocol negotiation
- Shielded SuperSpeed+ transmission lines
Bluetooth 5.3 and Wi-Fi 6E use special RF circuit layouts. They have dual-band antennas to reduce interference. The main differences are:
- 2.4GHz/5GHz frequency switching in Wi-Fi
- Adaptive frequency hopping in Bluetooth
- MIMO configurations for spatial streaming
Display Output Pathways
NVIDIA GeForce RTX 4090 Pipeline
The GPU render pipeline in this top card has:
- Ada Lovelace architecture’s SM units
- DLSS 3 frame generation nodes
- Dedicated RT cores for ray tracing
HDMI vs DisplayPort Signal Flows
| Protocol | Bandwidth | Refresh Rate | Audio Channels |
|---|---|---|---|
| HDMI 2.1 | 48Gbps | 120Hz (4K) | 32 |
| DisplayPort 2.1 | 80Gbps | 240Hz (8K) | 24 |
HDMI uses TMDS encoding for digital signal protocols. DisplayPort has micro-packet architecture with better error correction. Both now support VRR and HDR metadata embedding.
Software Layer Representation
Modern computer system diagrams show how software meets physical parts. This layer links hardware capabilities with apps, making systems work well together.
Operating System Framework
The operating system is the base software layer. It manages resources with structured kernels. OS kernel diagrams help explain how memory, processors, and devices interact.
Windows 11 Kernel Structure
Microsoft’s Windows 11 has a hybrid kernel. Its memory allocation maps show special areas for security, like Virtualization-Based Security (VBS). This helps keep threats away.
macOS Darwin Architecture
Apple’s macOS uses the XNU kernel, mixing Mach and BSD. Visual tools show its real-time scheduling. This is different from Windows’ way of handling hardware resources.
Application Ecosystem
Applications sit on top of the OS layer. They show cloud component mapping through connected services. Diagrams show how apps use local and remote resources.
Microsoft Office 365 Component Stack
Microsoft Office 365 has a service mesh architecture. It includes:
- A central identity management with Azure Active Directory
- Distributed data storage in SharePoint nodes
- Real-time collaboration through WebSocket protocols
Adobe Creative Cloud Services Map
Adobe’s ecosystem is based on microservices. It has:
- Regional content delivery networks
- AI tools like Sensei on AWS
- Encrypted asset syncing between devices
Data Flow Visualisation Techniques
Modern computing needs clear ways to show how data moves. Visual diagrams help engineers see how well systems work. They find what’s holding things back and make things better. There are two main ways: the von Neumann model for one thing at a time, and parallel systems for doing lots of things fast.

Von Neumann Architecture
This classic design goes through four stages one by one:
- Fetch: Get the command from memory
- Decode: Understand what the command means
- Execute: Do the calculation
- Store: Save the result in memory
Instruction Cycle Illustration
Pipeline diagrams show where things slow down. They use coloured bars to show idle time. This shows how old CPU designs aren’t always efficient.
Bottleneck Identification Methods
The von Neumann bottleneck is clear when you look at memory access. Workflow maps show when fetching instructions and getting data clash.
Parallel Processing Models
Today’s systems handle tasks in a different way. They split tasks up:
Multi-core CPU Task Allocation
Charts show how tasks are spread out among processors. Heat maps show which parts are working the hardest. The busier areas are shown in hotter colours.
GPU Compute Unified Diagrams
NVIDIA’s CUDA core mapping shows thousands of threads working together. Grid diagrams show how tasks are split up. This lets graphics and AI work much faster.
| Feature | Von Neumann | Parallel Models |
|---|---|---|
| Data Paths | Single | Multiple |
| Memory Access | Shared | Distributed |
| Best For | Linear Tasks | Bulk Processing |
Conclusion: System Integration Perspectives
Modern computer system synthesis is all about understanding how different parts work together. Tools like Boardmix or draw.io help show these connections. They reveal how CPU speeds and RAM bandwidth interact, and how SSDs affect app performance.
These diagrams make complex ideas easy to grasp for engineers and students. They turn abstract concepts into something you can act on.
When we’re trying to fix problems, looking at how components work together is key. A motherboard’s voltage control affects GPU performance, and how the operating system manages CPU use is also important. Designers use these diagrams to find the right balance between heat and processing power.
This is critical in places like data centres or edge computing setups.
As we move towards quantum computing, we’ll need new ways to show how these systems work. We’ll need tools that can handle the mix of quantum and classical systems. For now, learning to use current diagram tools is essential. It helps us improve AI or IoT networks.
 By
By